
by Paul Hoffmeister, Chief Economist
As we’ve outlined in recent months, financial markets transitioned in January from a ‘20-21 Covid recovery’ phase to today’s ‘high inflation, rate-hiking’ phase. With CPI growing 8.6% year-over-year in May (a 40-year high) and unemployment at a post-Covid low of 3.6%, the Federal Reserve is fixated on slowing economic activity to reduce inflation. As a result, the most important economic data in coming months will be inflation-related, as it will be a key driver of both monetary policy and the direction of stock and bond markets.
In mid-May, during a Wall Street Journal livestream, Jerome Powell summarized the Fed’s policy outlook in the following way: ‘What we need to see is clear and convincing evidence that inflation pressures are abating and inflation is coming down — and if we don’t see that, then we’ll have to consider moving more aggressively… If we do see that, then we can consider moving to a slower pace.’
At the end of May, many believed that the Federal Reserve would pause in September to evaluate the impact of this year’s rate increases. But with inflation remaining stubbornly high, Fed Vice Chair Lael Brainard said last week that it’s ‘very hard to see the case for a Fed pause’. As a result, markets discounted the possibility of even more rate hikes by year-end.
Federal funds futures currently suggest that the Fed will most likely raise the fed funds rate from its current 0.75%-1.00% range to somewhere between 3.00%-3.50% by year-end. This suggests the strong possibility of 50 basis point increases at each of the Fed’s next 5 policy meetings.
The recent increase in rate expectations coincided last week with the worst equity market performance since January, as the Dow, S&P 500 and Nasdaq respectively declined 4.6%, 5.0% and 5.6%.
With the trajectory of monetary policy and financial markets highly dependent on economic data, what data should investors monitor? The following slides show key data sets that we’ll be watching. They focus on inflation, inflation expectations, growth, and financial conditions.
Given the Fed’s operational framework today, the ideal market scenario will be for CPI to trend from 8.6% today toward 5% by year-end; inflation expectations to decline from 2.3% to the Fed’s long-run target of 2%; unemployment to stop declining or rise slowly to no higher than 4% during the next year; and for credit spreads to remain near current levels.
Arguably, this would be the ‘soft landing’ that many hope the Fed will be able to achieve, as it would likely avoid an economic recession and financial market crisis.
Unfortunately, the last three rate-hiking cycles preceded major economic and/or market disruptions. This history coupled with today’s steep rise in input and living costs as well as higher interest rates globally have made the Fed’s job exceedingly difficult. Therefore, we believe that a ‘hard landing’ is the more likely scenario in the next 12-24 months.
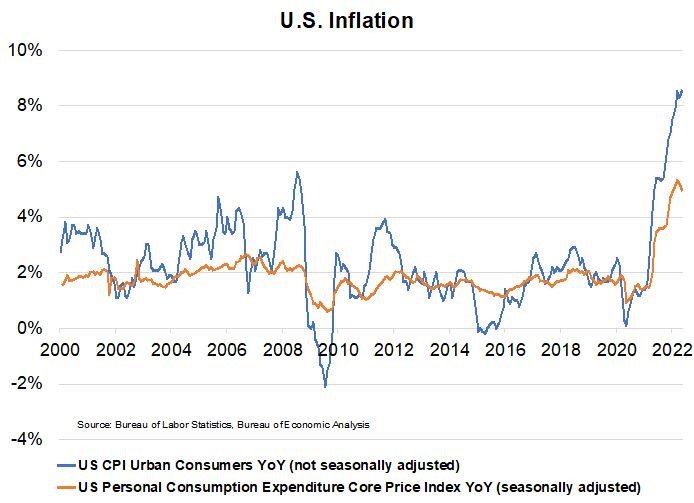
In May, CPI rose 8.6% year-over-year, while the core PCE Index increased 4.9%.
Inflation is unacceptably high due to a number of factors, including supply chain disruptions, the Ukraine conflict, and high energy prices.
Fed is currently failing its price stability mandate and 2% long-run inflation target.
Doves are hoping that an inventory glut, reduced demand in China, and base year effects will pull CPI lower to 5% by year-end.

The 5-year breakeven inflation rate is currently 2.32%.
The breakeven inflation rate represents a measure of expected inflation derived from 5-Year Treasury constant maturity securities and 5-Year Treasury inflation-indexed constant maturity securities. The latest value implies what market participants expect inflation to be in the next 5 years, on average.
Fed officials may perceive the recent decline in inflation expectations as validation of their recent hawkishness.

In May, the US unemployment rate fell to 3.6%, a post-Covid low.
The “Sahm Rule” posits that recessions have in the past occurred whenever the 3-month moving average of the unemployment rate rises 0.5 percentage points over its minimum rate over the previous 12 months.
This suggests that the US economy will be on the verge of or entering recession if the unemployment rate exceeds 4% during the next year.

One of our favorite indicators of financial conditions is the spread between Moody’s Baa and Aaa-rated corporate bonds.
Spread of 150 basis points or more suggests severe financial conditions.
Spread below 100 basis points suggests a relatively favorable financial environment.
We’ll become concerned about the economic and systemic financial risk if the Baa-Aaa spread breaches and keeps rising past 100 basis points… It recently traded at 97 bps.

We believe more economic and financial pain are ahead.
Each of the last 3 rate-hiking cycles preceded severe economic or financial conditions.
The 99-00 cycle preceded the Tech Wreck; 04-06 preceded the Great Financial Crisis; and 2015-2018 culminated with a nearly 20% decline in the S&P 500 in Q4 2018.
Employment and financial conditions are strong today. But with headline inflation at a 40-year high, the Fed is aggressively moving the US economy into its latest rate-hiking cycle.
DIAL IN FOR OUR MONTHLY
EVENT-DRIVEN CALL
Every 3rd Wednesday at 2:00pm EST
REGISTER FOR CALL

Paul Hoffmeister is chief economist and portfolio manager at Camelot Portfolios, managing partner of Camelot Event-Driven Advisors, and co-portfolio manager of the Camelot Event-Driven Fund (tickers: EVDIX, EVDAX).

Camelot Event-Driven Advisors LLC | 1700 Woodlands Drive | Maumee, OH 43537 // B376
Disclosures:
• Past performance may not be indicative of future results. Therefore, no current or prospective client should assume that the future performance of any specific investment, investment strategy (including the investments and/or investment strategies recommended by the adviser), will be profitable or equal to past performance levels.
• This material is intended to be educational in nature, and not as a recommendation of any particular strategy, approach, product or concept for any particular advisor or client. These materials are not intended as any form of substitute for individualized investment advice. The discussion is general in nature, and therefore not intended to recommend or endorse any asset class, security, or technical aspect of any security for the purpose of allowing a reader to use the approach on their own. Before participating in any investment program or making any investment, clients as well as all other readers are encouraged to consult with their own professional advisers, including investment advisers and tax advisors. Camelot Event Driven Advisors can assist in determining a suitable investment approach for a given individual, which may or may not closely resemble the strategies outlined herein.
• Any charts, graphs, or visual aids presented herein are intended to demonstrate concepts more fully discussed in the text of this brochure, and which cannot be fully explained without the assistance of a professional from Camelot Portfolios LLC. Readers should not in any way interpret these visual aids as a device with which to ascertain investment decisions or an investment approach. Only your professional adviser should interpret this information.
• Some information in this presentation is gleaned from third party sources, and while believed to be reliable, is not independently verified.
• Camelot Event-Driven Advisors, LLC, is registered as an investment adviser with the United States Securities and Exchange Commission. Registration as an investment adviser does not imply any certain degree of skill or training. Camelot Event-Driven Advisors, LLC’s disclosure document, ADV Firm Brochure is available at http://adviserinfo.sec.gov/firm/summary/291798
Copyright © 2022 Camelot Event-Driven Advisors, All rights reserved.