Fed in Control of Stocks

by Paul Hoffmeister, Chief Economist

  • The most important macroeconomic variable today is the Fed.

  • The correlation this year between the Fed’s hawkish shift and weak equity markets is seemingly undeniable.

  • Equities will find support when the Fed stops pushing longer-term rate expectations higher.

  • Weaker economic activity and improved inflation data in coming months should stall the hawkish Fed momentum.

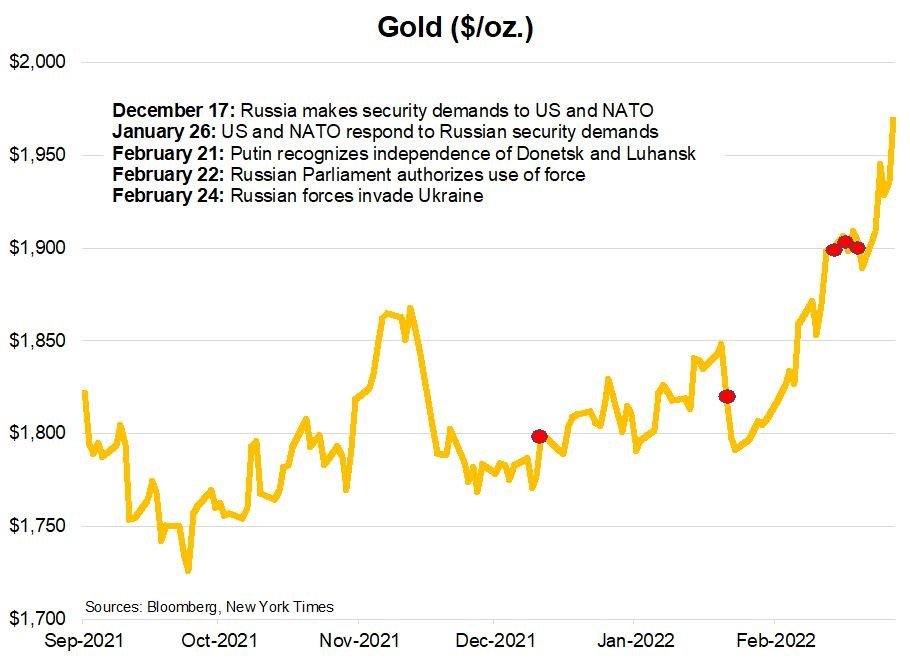
The macroeconomic circumstance of financial markets today appears to be fairly straight-forward. The U.S. economy has strongly recovered from the Covid pandemic, but inflation is now uncomfortably high and the Federal Reserve is focused on raising interest rates to slow growth to alleviate those inflationary pressures. In addition, the war in Ukraine has worsened inflation by exacerbating food and energy prices. Not to mention, it may have increased some risk for the financial sector due to concerns about Russian banks, the possibility of a Russian sovereign default, and general geopolitical uncertainty between the West and Russia.

But arguably, the most important macroeconomic variable in the world today is the Fed, and more specifically, its plan to raise interest rates. The major shift toward the hawkish Fed outlook that we have today began around the beginning of the year.

On January 5th, the Fed released the minutes of its FOMC meeting on December 14-15. The minutes stated that “it may become warranted to increase the federal funds rate sooner or at a faster pace than participants had earlier anticipated.” During the weeks that followed, Fed officials began to telegraph a change in monetary policy, including a March rate increase. The January 26 FOMC statement ultimately confirmed that shift: “With inflation well above 2 percent and a strong labor market, the Committee expects it will soon be appropriate to raise the target range for the federal funds rate.” Since then, the hawkish Fed rhetoric has steadily increased as year-over-year CPI growth jumped to 8.5% and unemployment fell to 3.6%.

As a result, the 10-year Treasury yield has been on a tear higher this year, jumping from 1.51% on December 31st to more than 3.10% as of Friday.

The correlation between the Fed’s hawkish shift and weak equity markets is seemingly undeniable. As the chart below shows, the breakout in long-term interest rates in recent months has correlated with the selloff in the S&P 500.

Of course, financial markets aren’t driven by only one variable. For example, the invasion of Ukraine in late February was another factor that temporarily impacted stocks and bonds. But the general correlation between stocks and monetary policy this year underscores for us, once again, just how impactful Fed policy can be for financial markets.

So, as investors, where do we go from here?

If the predominant market variable is Fed policy, the first question we need to answer is: will the Fed outlook materially change from where it stands today? If we try to understand markets with this simple framework, it would suggest that additional signals from the Fed of even higher-than-expected interest rates will translate into further equity market weakness; and vice versa.

Unfortunately, last Friday, former Fed Vice Chairman Richard Clarida suggested that the federal funds rate will need to rise to at least 3.50% to get inflation under control. Currently, based on fed funds futures, the market seems to be expecting almost a 3.25% funds rate by year-end 2023. Therefore, Clarida’s comments were new, hawkish comments that markets needed to digest and discount.

If Clarida’s comments are any indication, it appears that the Fed has some more hawkish “telegraphing” to go. And, it's difficult to forecast how much further it will go in the coming weeks and months.

But to look at things optimistically today, the Fed has shifted market expectations significantly already. At the beginning of the year, fed funds futures were expecting nearly a 1.25-1.50% funds rate by year-end 2023. The futures market now expects approximately 3.25%. As such, the market has priced in nearly 200 basis points of additional rate increases for the medium-term policy horizon.

It's likely as well that the inflation picture will improve soon.

The Fed’s intention is to slow growth to reduce inflationary pressures (however flawed its policy tool is). The recent rise in interest rates, and the general rise in input costs and living costs, are likely having a dampening effect on growth already, which should translate into limited inflation gains in the coming months.

Furthermore, the post-pandemic phenomenon where consumers increased spending on goods could start to wane, and the ratio between goods and services spending could normalize. What this means is, the boom in spending on refrigerators and other household items, for example, should decline as consumers start spending more on travel and other services. If this normalization in spending patterns occurs, it should alleviate goods demand and bottlenecks in the supply chain; both of which should reduce the pressure on inflation statistics.

In sum, we could start to see slightly slowing economic growth AND a peak in inflation data. It’s possible, for example, that the year-over-year growth in CPI will start to decline from its current 8.5% rate to 4-5% by year-end.

In this scenario, we could see the aggressively hawkish Fed rhetoric of the last four months start to calm. And in turn, holding all other variables constant, this could ultimately translate into equity markets finding support again. Hopefully, nothing else in the global economy breaks in the meanwhile.

DIAL IN FOR OUR MONTHLY
EVENT-DRIVEN CALL
Every 3rd Wednesday at 2:00pm EST

 REGISTER FOR CALL

Paul Hoffmeister is chief economist and portfolio manager at Camelot Portfolios, managing partner of Camelot Event-Driven Advisors, and co-portfolio manager of the Camelot Event-Driven Fund  (tickers: EVDIX, EVDAX).

Camelot Event-Driven Advisors LLC | 1700 Woodlands Drive | Maumee, OH 43537 //  B372

Disclosures:
• Past performance may not be indicative of future results. Therefore, no current or prospective client should assume that the future performance of any specific investment, investment strategy (including the investments and/or investment strategies recommended by the adviser), will be profitable or equal to past performance levels.
• This material is intended to be educational in nature, and not as a recommendation of any particular strategy, approach, product or concept for any particular advisor or client. These materials are not intended as any form of substitute for individualized investment advice. The discussion is general in nature, and therefore not intended to recommend or endorse any asset class, security, or technical aspect of any security for the purpose of allowing a reader to use the approach on their own. Before participating in any investment program or making any investment, clients as well as all other readers are encouraged to consult with their own professional advisers, including investment advisers and tax advisors. Camelot Event Driven Advisors can assist in determining a suitable investment approach for a given individual, which may or may not closely resemble the strategies outlined herein.
• Any charts, graphs, or visual aids presented herein are intended to demonstrate concepts more fully discussed in the text of this brochure, and which cannot be fully explained without the assistance of a professional from Camelot Portfolios LLC. Readers should not in any way interpret these visual aids as a device with which to ascertain investment decisions or an investment approach. Only your professional adviser should interpret this information.
• Some information in this presentation is gleaned from third party sources, and while believed to be reliable, is not independently verified.
• Camelot Event-Driven Advisors, LLC, is registered as an investment adviser with the United States Securities and Exchange Commission. Registration as an investment adviser does not imply any certain degree of skill or training. Camelot Event-Driven Advisors, LLC’s disclosure document, ADV Firm Brochure is available at http://adviserinfo.sec.gov/firm/summary/291798

Copyright © 2022 Camelot Event-Driven Advisors, All rights reserved.

Fed Will Use a ‘Brute-Force’ Tool

by Paul Hoffmeister, Chief Economist

  • Fed ready to raise rates aggressively.

  • Recession risk appears contained, for now.

  • Ukraine peace deal outlined but not imminent.

  • Betting markets overwhelmingly favor Macron in France’s April 24 election and Republicans in the midterms.

Higher Interest Rates: According to the Bureau of Economic Analysis, the CPI and PCE indices respectively increased 7.9% and 5.4% year-over-year through February, and the unemployment rate stood at 3.6%. Against this backdrop, monetary policymakers are currently more concerned about inflation than growth. And they appear ready to act by raising interest rates aggressively.

On March 16, the FOMC raised the funds rate target range to 0.25%-0.50%; its first increase in more than three years. It also telegraphed another 6 rate increases by year-end, and another three increases in 2023.

Underscoring the Fed’s inflation concerns, St. Louis Federal Reserve President James Bullard said last week that the Fed is “behind the curve” and suggested it must raise the overnight benchmark rate to 3.50%[i]. Soon thereafter, Fed Governor Lael Brainard indicated that the Fed will likely shrink its balance sheet “considerably more rapidly than in the previous recovery”. She added, “It is of paramount importance to get inflation down”. [2]

As a result, the market’s expectations of future monetary policy have caused long-term interest rates to skyrocket, with the 10-year Treasury yield jumping from approximately 1.50% at the beginning of this year to 2.75% as of last week.

The intention of interest rate increases, or what’s called the “monetary transmission mechanism”, is to slow the economy in order to ultimately reduce price pressures. Arguably, the interest rate lever is a blunt tool, and a natural concern is whether the Fed will succeed in threading the needle by engineering a so-called soft economic landing while reducing inflationary pressures at the same time.

Federal Reserve Governor Christopher Waller seemed to echo this sentiment on April 11. He said: “When you have to use a brute-force tool, sometimes there’s some collateral damage that happens. We’re trying to do this in a way that there’s not much of it, but we can’t tailor policy.”[iii]

We’re skeptical that the Fed will succeed in reducing inflationary pressures by raising rates aggressively without harming certain segments of the economy. But, for now, recession doesn’t appear to be imminent. The New York Federal Reserve’s probability of recession indicator for the next 12 months shows a 5.5% chance of recession.

Ukraine War:

The financial panic following the February 24 Russian invasion of Ukraine has significantly abated. As of Friday April 8, the S&P 500 is up more than 7% from its post-invasion low on March 8 and close to its trading levels in mid-February. Meanwhile, the USD-Ruble exchange rate is trading around 81.50 per dollar, compared to 78.65 on February 23 and nearly 135 rubles on March 10. Gold, arguably a useful geopolitical barometer, is trading around $1955, compared to $1910 on February 23 and its peak of $2050 on March 8.

Holding all other macro variables constant, these market prices suggest that the worst of the financial panic related to the Ukraine war is behind us for the near-term. However, the long-term consequences of this conflict are significant; they include higher inflation, slower economic growth, and the continued realignment of the global order.

According to AAA, the national average for a gallon of gasoline in the United States increased to $4.11 on April 8 from $3.54 on February 23. Meanwhile, according to the Chicago Mercantile Exchange, corn and wheat prices have increased approximately 13% and 21%, respectively. This is consistent with the 12.6% jump in the United Nation’s Food Price Index in March, which is the highest level for that index since its inception in 1990. Furthermore, in certain parts of the world, the price of fertilizer has increased more than 30%.

With the jump in food prices and the fact that Ukraine and Russia account for 20% and 30% of global wheat and corn exports, fears of a global food crisis are legitimate. Not to mention, an incipient rise in the cost of living will negatively impact consumers and the global economy.

Even more, we continue to see a bifurcation of the world into two economic spheres: the West with the United States at its center, and the East with China at its center and secondarily Russia.

While this bifurcation has been slowly in the making -- and we’ve highlighted it in recent years -- its reality was underscored again on February 4 when Presidents Xi Jinping and Vladimir Putin met and declared a partnership to counter the United States, stating: "Friendship between the two States has no limits, there are no 'forbidden' areas of cooperation." Among many other agreements, the countries forged a $117B Russian gas deal, Russia voiced its support for China’s stance on Taiwan and opposed NATO expansion and the AUKUS alliance (the alliance between Australia, UK and USA).[iv]

Thus far, the fighting in Ukraine does not appear to have dented the Chinese-Russian alliance. On Monday March 7, for example, China’s Foreign Minister Wang Yi emphasized that the relationship was “rock solid”.[v]

While the global order is important and its implications massive, the more acute concern for financial markets is the war right now. Will the fighting end soon? Or will it spill over into bordering countries?

On March 29, Russian and Ukrainian negotiators reached the outlines of a possible peace deal. Kiev would agree to not join alliances or host bases of foreign troops, but would have security guarantees similar to NATO’s Article 5 collective defense clause. Additionally, there would be a 15-year consultation period on the status of Crimea, which was annexed by Russia in 2014, and the status of the Donbas region would be worked out during direct talks between Putin and Zelensky.[vi] Kiev presented Moscow with a draft proposal last week, and the Russian government quickly proclaimed that it contained “unacceptable” elements, including details that were contrary to what had been previously discussed.[vii] Clearly, any peace deal will require more time. Many military observers expect Russian troops, after regrouping recently, will focus and step up operations in Eastern Ukraine.

Political Outlook:

A major political shift appears on the horizon in the United States. According to Predictit, Republicans currently have an 85% and 75% probability of regaining control of the House and Senate, respectively… Meanwhile, the Predictit market is giving Emmanuel Macron almost an 80% chance of beating Marine Le Pen in France’s second round presidential election, to be held on April 24. We wouldn’t easily assume a Macron victory. A Le Pen upset could be as significant as the Brexit referendum result of June 2016

[i] “Fed’s Bullard says interest rate policy is ‘behind the curve’, but it’s making progress”, by Jeff Cox, April 7, 2022, CNBC.
[ii] Fed’s balance sheet runoff will be rapid, Brainard says”, by Ann Saphir and Lindsay Dunsmuir, April 5, 2022, Reuters.
[iii] “Fed’s Waller Nods to Economic ‘Collateral Damage’ as Rates Rise,” by Craig Torres, April 12, Bloomberg News.
[iv] “China, Russia partner up against West at Olympics summit”, by Tony Munroe, February 5, Reuters.
[v] “China says Russia relations are still ‘rock solid’”, March 6, Deutsche Welle.
[vi] “Russia pledges to reduce attack on Kiev, but US warns threat not over”, by Jonathan Spicer, March 29, Reuters.
[vii]“Russia says Ukraine presented ‘unacceptable’ draft peace deal”, April 7, Reuters.

DIAL IN FOR OUR MONTHLY
EVENT-DRIVEN CALL
Every 3rd Wednesday at 2:00pm EST

REGISTER FOR CALL

Paul Hoffmeister is chief economist and portfolio manager at Camelot Portfolios, managing partner of Camelot Event-Driven Advisors, and co-portfolio manager of the Camelot Event-Driven Fund (tickers: EVDIX, EVDAX).

Camelot Event-Driven Advisors LLC | 1700 Woodlands Drive | Maumee, OH 43537 // B341

Disclosures:
• Past performance may not be indicative of future results. Therefore, no current or prospective client should assume that the future performance of any specific investment, investment strategy (including the investments and/or investment strategies recommended by the adviser), will be profitable or equal to past performance levels.
• This material is intended to be educational in nature, and not as a recommendation of any particular strategy, approach, product or concept for any particular advisor or client. These materials are not intended as any form of substitute for individualized investment advice. The discussion is general in nature, and therefore not intended to recommend or endorse any asset class, security, or technical aspect of any security for the purpose of allowing a reader to use the approach on their own. Before participating in any investment program or making any investment, clients as well as all other readers are encouraged to consult with their own professional advisers, including investment advisers and tax advisors. Camelot Event Driven Advisors can assist in determining a suitable investment approach for a given individual, which may or may not closely resemble the strategies outlined herein.
• Any charts, graphs, or visual aids presented herein are intended to demonstrate concepts more fully discussed in the text of this brochure, and which cannot be fully explained without the assistance of a professional from Camelot Portfolios LLC. Readers should not in any way interpret these visual aids as a device with which to ascertain investment decisions or an investment approach. Only your professional adviser should interpret this information.
• Some information in this presentation is gleaned from third party sources, and while believed to be reliable, is not independently verified.
• Camelot Event-Driven Advisors, LLC, is registered as an investment adviser with the United States Securities and Exchange Commission. Registration as an investment adviser does not imply any certain degree of skill or training. Camelot Event-Driven Advisors, LLC’s disclosure document, ADV Firm Brochure is available at http://adviserinfo.sec.gov/firm/summary/291798

Copyright © 2022 Camelot Event-Driven Advisors, All rights reserved.

Most Sanctions Fail

by Thomas Kirchner, CFA

  • From substitute for war to forcing domestic policy change.

  • Declining success rate of sanctions in the last 25 years.

  • Russia sanctions cost West more than Russia.

  • World needs a new Vienna Congress.

In 433 BC, Athens barred merchants from neighboring Megara from selling their wares in the Athens market. These earliest recorded sanctions didn't work out too well for the Athenians. The Megarians teamed up with the Spartans to wage the Peloponnesian War, which ended Athens' golden age [I]. The effectiveness of sanctions has not become much better since antiquity. Famously, sanctions on Iraq and Cuba helped Saddam Hussein and Fidel Castro cement their power by allocating scarce imports to their most loyal supporters.

We decided to take a closer look at the Global Sanctions Data Base (GSDB) that is maintained by a team of researchers and spans 1,101 sanctions measures over the period 1950-2019 [ii]. The database does not cover sanctions of the 1920s and 30s, when uncoordinated ad-hoc measures against the axis powers contributed to the collapse of world trade but failed to prevent World War II. After all, following the horrors of World War I, sanctions became the go-to tool for warfare in the 1920s, replacing military conflict through economic warfare. President Woodrow Wilson proclaimed in 1919: “A nation that is boycotted is a nation that is in sight of surrender.” [iii] That, at least, was the idea, which has since become religion. As we will discuss, wrongly so.

The most sanctioned regions will surprise you

The GSDB reveals that, not surprisingly, the countries of North America, Northwestern Europe and Oceania are the least frequently ones targeted by sanctions. Less obvious is that Africa and West Asia are targeted most frequently. Interestingly, most sanctions on African countries are imposed by other African countries. We wonder if much of Africa's regionalism is due to these sanctions. After all, if you want to fly from one African city to another, the only flights available often make you connect through London, Paris or Frankfurt.

Since 1950, the U.S. has been the most frequent sanctioning nation, imposing more than one third of all sanctions worldwide. Under President Obama, the share of all sanctions imposed by the U.S. declined to 30%, in particular after Iran sanctions were lifted in 2016, but rose in the subsequent four years under President Trump to 40%. Trump is said to have been the most active sanctioner of all time, averaging three new measures per day [iv].

From avoiding war to influencing domestic policies

The policy objectives of sanctions have evolved over the years. Sanctions evolved from a substitute for war, as in Wilson's days, to a tool to influence domestic policies in another country. Until 1960, war and territorial conflicts were the principal reasons for sanctions. From the 1970s, human right-related sanctions started to increase, which due to their sharp increase cumulatively represent the largest category since 1950. Democracy is the second-most frequent category. Ending wars is only the 4th most frequent objective for sanctions [iv]. We would assume that this drift toward domestic policy changes also makes sanctions less effective. After all, human rights violations or other objectionable domestic policies are often at the core of a regime's power base. Being sanctioned then is just one of the many costs of staying in power.

Effectiveness

Not surprisingly, the effectiveness of sanctions is hotly contested. Clearly, sanctions labeled “crippling” are imposed with a strong conviction that they will achieve their stated goals. Unfortunately, the data stand in sharp contrast to such overconfident boisterous announcement. Successes are rare. A notable exception are the 1995 sanctions against Peru and Ecuador after border skirmishes along a long-contested area near the Cenepa river had broken out. The sanctions were lifted after both sides consented to the deployment of international observers. However, since this is not a controlled experiment, we can not rule out the possibility that the same outcome would have been had without the imposition of sanctions. Attributing such successes to sanctions might overrate their effectiveness.

Until the mid-1960s, 50% of sanctions in the GSDB are classified as failures, only 20-30% are successes. The situation improved over the following 30 years: by 1995, 50% of all sanctions were considered a complete success. Unfortunately, in the quarter century since 1995, there is a sharp decrease in the success rate. As of 2016, only 20% of sanctions are deemed a complete success, roughly 70% are “ongoing”, which in many cases probably means that nobody wants to admit their failure, so the path of least resistance is to keep them going [iv]. Partly, the decreasing success rate is due to the sharp rise in anti-terrorism sanctions, which we would expect to be of little deterrence on the determination of terror fanatics.

Sanctions against Russia over the Ukraine war

JP Morgan estimates the impact of sanctions on the Russian economy on 11% of GDP and reduced growth in the EU at 2.1% of GDP[v]. This estimate amounts to $165 billion in annual sanction losses for Russia and at least $357 billion for the EU alone, even more if you add non-EU Europe and North America [vi]. As long as JP Morgan's estimates are not completely wrong, the West will suffer more under its own sanctions than Russia. We estimate that only for a contraction of 30% or more will the harm to Russia be worse than for the West. Should gas deliveries to Western Europe be disrupted, then no crash of the Russian economy would be big enough to match the economic devastation of Western Europe.

We can think of other ways how the sanctions are likely to backfire. For example, the ban on exporting technology will only have a short-term impact. We would like to remind readers that the Soviet Union perfected the art of procuring Western technology at the time of the iron curtain. In fact, Soviet microprocessors were copies of Intel and Zilog chips, the export of which to the Warsaw Pact was illegal. We would expect this phenomenon to return as a result of the sanctions. Fake chips from China are already a major problem for the semiconductor industry. If China can manufacture fake chips on a large scale, there is no reason why Russia wouldn't be able to do the same. Such fake chips, which will be much cheaper than the genuine ones, will then find their way into the Western market, where they will only aggravate the scourge of fake chips.

While we certainly wish that sanctions on Russia would end this war quickly, we won't hold our breath. The deck is stacked against their effectiveness. What this conflict needs is a diplomatic solution: a new Vienna Congress.

[i] Camelot calculations based on Bloomberg data.

[ii] Gabriel Felbermayr, Aleksandra Kirilakha, Constantinos Syropoulos, Erdal Yalcin, Yoto V. Yotov: The Global Sanctions Data Base. LeBow College of Business, Drexel University, School of Economics Working Paper Series, WP 2020-02.

[iii] Maxim Trudolyubov: “Sanctions Should Impose Costs Where They Are Due” Wilson Center, September 20, 2020.

[iv] Gabriel Felbermayr, Aleksandra Kirilakha, Constantinos Syropoulos, Erdal Yalcin, Yoto V. Yotov: “The Global Sanctions Data Base: An Update that Includes the Years of the Trump Presidency” LeBow College of Business, Drexel University, School of Economics Working Paper Series, WP 2021-10.

[v] Randall W. Forsyth: “Putin’s War Puts Russia’s Economy—and the World’s—in Its Crosshairs.” Barron's, March 2, 2022.

[vi] Camelot calculations based on World Bank data.

DIAL IN FOR OUR MONTHLY

EVENT-DRIVEN CALL

Every 3rd Wednesday at 2:00pm EST

REGISTER FOR CALL

Thomas Kirchner, CFA, has been responsible for the day-to-day management of the Camelot Event Driven Fund (EVDIX, EVDAX) since its 2003 inception. Prior to joining Camelot he was the founder of Pennsylvania Avenue Advisers LLC and the portfolio manager of the Pennsylvania Avenue Event-Driven Fund. He is the author of 'Merger Arbitrage; How To Profit From Global Event Driven Arbitrage.' (Wiley Finance, 2nd ed 2016) and has earned the right to use the CFA designation.

Camelot Event-Driven Advisors LLC | 1700 Woodlands Drive | Maumee, OH 43537 // B340

Disclosures:
• Past performance may not be indicative of future results. Therefore, no current or prospective client should assume that the future performance of any specific investment, investment strategy (including the investments and/or investment strategies recommended by the adviser), will be profitable or equal to past performance levels.
• This material is intended to be educational in nature, and not as a recommendation of any particular strategy, approach, product or concept for any particular advisor or client. These materials are not intended as any form of substitute for individualized investment advice. The discussion is general in nature, and therefore not intended to recommend or endorse any asset class, security, or technical aspect of any security for the purpose of allowing a reader to use the approach on their own. Before participating in any investment program or making any investment, clients as well as all other readers are encouraged to consult with their own professional advisers, including investment advisers and tax advisors. Camelot Event Driven Advisors can assist in determining a suitable investment approach for a given individual, which may or may not closely resemble the strategies outlined herein.
• Some information in this presentation is gleaned from third party sources, and while believed to be reliable, is not independently verified.
• Camelot Event-Driven Advisors, LLC, is registered as an investment adviser with the United States Securities and Exchange Commission. Registration as an investment adviser does not imply any certain degree of skill or training. Camelot Event-Driven Advisors, LLC’s disclosure document, ADV Firm Brochure is available at http://adviserinfo.sec.gov/firm/summary/291798

Copyright © 2021 Camelot Event-Driven Advisors, All rights reserved

Tech Crash: what's Next?

by Thomas Kirchner, CFA

  • Unprofitable tech to continue sliding.

  • Bright spots in Chinese tech.

  • Many SPAC’s will soon trade below cash.

Last week's short-lived tech rally pushed some unprofitable tech stocks up nearly 50%. As remarkable as such a move is, strong temporary moves to the upside are nothing unusual in a market that is crashing. And “crash” is the best description of what some areas of the technology sector are going through.

Tech stocks, as measured by NASDAQ, peaked on November 19, 2021. However, if we look at the subset of unprofitable growth stocks, former unicorns that have seen tremendous growth in their stock prices in recent years or former SPACs, then the peak in many of these stocks occurred a few months earlier shortly after the meme stock mania. Chinese tech stocks, in turn, peaked in late 2020 as the Chinese government clampdown on tech companies began. [i]

Profitable vs. unprofitable tech

The distinction between profitable and unprofitable tech appears to have been a big driver of the performance differential since last year's peak, and we believe this will become even more critical during the next two years.

For some firms, Covid has been an accelerator that brought long-term technology adoption forward. For others, it represented a one-time boost. For most tech companies, it seems to have been a combination of both: technology adoption was accelerated by Covid well above the long-term trend. With the return to normal, we expect to see a pullback toward the trendline. The exuberant enthusiasm for profitable stay-at-home-stocks has since turned into a hangover, with many of these firms giving back much of their multiple expansions. While the worst valuation excesses in some of these stocks have since been rectified by the market, we still would avoid these former market darlings.

Unprofitable tech firms have become an asset class of their own. Similarities to the dot-com boom of the late 1990s abound with a singular focus on growth and questionable business models. Even companies in the gig economy, and even real estate subletting firms have been classified as “tech” on the mere basis that these firms have an app as an interface with their customer. Many of these business models are, in our view, unsustainable.

For example, food delivery should be a straightforward cash business. Yet, not a single food delivery company we are aware of is profitable, even though employees often are not even earning minimum wage. The same applies to ride hailing apps, the other part of the gig economy that benefits from large valuations. These companies failed to turn a profit for years while growing. This would be plausible if newly acquired business takes time to become profitable. However, they still fail to become profitable when growth slows, and they should be able to harvest cash flow. The absence of such profits has us conclude that it is simply not possible to run many businesses in the gig economy profitably.

Chinese tech

We asked in December if Chinese tech stocks have bottomed. As we pointed out at the time, the clampdown on Chinese tech firms was caused by the power struggle in the CCP between President Xi's clan, which advocates traditional authoritarian communism with limited market elements, and supporters of former Premier Jiang Zemin, who advocate further free-market reforms, a group that includes many tech entrepreneurs. It appeared at the time that Xi had consolidated his power to a point where a third term at the Congress in September was a given. However, after the Olympics turned out to be less of a PR success than anticipated for President Xi, it is not surprising that a new wave of power consolidation hits Chinese tech stocks with reports of a new attack on Ant Financial, whose shelved IPO was the beginning of the clampdown in November 2020, and ride-hailing app Didi.

It appears that the vigor of the adverse market reaction to the renewed tech clampdown took Chinese authorities by surprise. This explains Chinese officials' comments, led by Vice-Premier Liu He last Wednesday, that authorities need to take a “standardized, transparent and predictable” approach to regulation [ii]. We believe that regulatory risks to Chinese tech stocks are now minimal because further attempts to consolidate power at the expense of financial markets would backfire and put the wisdom of the party's leadership in question.

The main risk to Chinese tech stocks listed in the U.S, now comes from Washington and the potential for delisting. This can play out in two ways: Chinese tech companies delisted in the U.S. could simply relist in Hong Kong, as Didi plans to do. An OTC market for ADRs may develop in the U.S. The other option would be a going private transaction at a low valuation followed by a relisting in Hong Kong. With the sharp correction in the Hang Seng tech index, this has become less attractive unless the discount that can be had by the buyout group in U.S. markets becomes extreme. In such a scenario, we expect investors to exercise dissenters' rights en masse.

SPAC crash

612 SPACs are currently looking for targets to take public through reverse mergers [iii]. This compares to about 4,000 companies currently traded publicly in the U.S. If each SPAC were successful, the number of publicly traded companies would expand by nearly 15% within the next two years after having declined from 5,500 in the 20 years from 2000 to 2020 [iv]. We expect that a large number of SPACs will liquidate without a merger, which will result in the sponsors losing their investment. Sponsor capital will provide the yield on investor cash held in the SPAC's trust account. We estimate the potential transfer of sponsor equity to public SPAC investors at up to $3bn [v].

The desperation of SPAC sponsors to get a deal done so that they do not lose their investment shows itself in the large number of questionable businesses models that SPACs have taken public.

Too many former SPACs fall into the category of lossmaking tech companies. Without the ability to raise new capital, their market value will eventually fall below the cash on their balance sheet, while they burn through cash. We anticipate seeing a re-run of the early 2000s, when activists acquired controlling stakes in these fallen angels at steep discounts to cash on the balance sheet, took control of the board and then simply liquidated the firms and distributed the cash. For many investors, that was the best outcome compared to letting the companies burn through the remaining cash.

The tech crash offers interesting opportunities for shrewd investors, even on the long side. As always, caveat emptor.


[i] Camelot calculations based on Bloomberg data.
[ii] “China stocks leap after State Council pledges support for economy, capital markets.” Reuters, March 16, 2022.
[iii] spacinsider.com/stats/ retrieved on 3/21/22.
[iv] Vartika Gupta, Tim Koller, Peter Stumpner: “Reports of corporates’ demise have been greatly exaggerated.” McKinsey Insights, McKinsey & Company, October 21, 2021.
[v] Camelot calculations.

DIAL IN FOR OUR MONTHLY
EVENT-DRIVEN CALL
Every 3rd Wednesday at 2:00pm EST

REGISTER FOR CALL

Thomas Kirchner, CFA, has been responsible for the day-to-day management of the Camelot Event Driven Fund (EVDIX, EVDAX) since its 2003 inception. Prior to joining Camelot he was the founder of Pennsylvania Avenue Advisers LLC and the portfolio manager of the Pennsylvania Avenue Event-Driven Fund. He is the author of 'Merger Arbitrage; How To Profit From Global Event Driven Arbitrage.' (Wiley Finance, 2nd ed 2016) and has earned the right to use the CFA designation.

Camelot Event-Driven Advisors LLC | 1700 Woodlands Drive | Maumee, OH 43537 // B336


Disclosures:
• Past performance may not be indicative of future results. Therefore, no current or prospective client should assume that the future performance of any specific investment, investment strategy (including the investments and/or investment strategies recommended by the adviser), will be profitable or equal to past performance levels.
• This material is intended to be educational in nature, and not as a recommendation of any particular strategy, approach, product or concept for any particular advisor or client. These materials are not intended as any form of substitute for individualized investment advice. The discussion is general in nature, and therefore not intended to recommend or endorse any asset class, security, or technical aspect of any security for the purpose of allowing a reader to use the approach on their own. Before participating in any investment program or making any investment, clients as well as all other readers are encouraged to consult with their own professional advisers, including investment advisers and tax advisors. Camelot Event Driven Advisors can assist in determining a suitable investment approach for a given individual, which may or may not closely resemble the strategies outlined herein.
• Some information in this presentation is gleaned from third party sources, and while believed to be reliable, is not independently verified.
• Camelot Event-Driven Advisors, LLC, is registered as an investment adviser with the United States Securities and Exchange Commission. Registration as an investment adviser does not imply any certain degree of skill or training. Camelot Event-Driven Advisors, LLC’s disclosure document, ADV Firm Brochure is available at http://adviserinfo.sec.gov/firm/summary/291798

Copyright © 2021 Camelot Event-Driven Advisors, All rights reserved.

War in Ukraine: Risk of Systemic Shock

by Paul Hoffmeister, Chief Economist

  • Since February 1, the S&P 500 is down over 4%, gold up more than 9%, and oil up over 20%, according to Bloomberg.

  • Ukrainian President Zelensky is demanding that NATO impose a no-fly zone over his country, warning that “all the people who die from this day forward will die because of you”. On Saturday, March 5, Vladimir Putin warned the West, “Any movement in this direction will be considered by us as participation in an armed conflict by that country.”

  • The potential exists of a systemic shock to the global economy if financial intermediation becomes paralyzed due to the economic and financial consequences of the conflict.

After weeks of tension, Vladimir Putin invaded Ukraine on February 24, and in addition to the human toll, the financial consequences have been stark. According to Bloomberg, since February 1, the S&P 500 is down over 4%, gold up more than 9%, and oil up over 20%.

As gold is arguably a useful reflector of geopoltical developments, the above gold chart illustrates the correlation between the evolution of recent Ukraine events and ultimately market prices, such as gold.

On December 17, Russia published draft security pacts for the US and NATO. Included in its demands to the West were denying NATO memberships to Ukraine and other post-Soviet countries, rolling back troops and weapons in central and eastern Europe, and other limits on Western military activities near Russia. The US and NATO responded in writing on January 26.[i] In a brief moment of hope, Secretary of State Blinken called the response a “serious diplomatic path” to resolving the dispute. But, shortly thereafter, Russian Foreign Minister Lavrov said that he saw “no positive reaction” to Russia’s demands, which echoed Kremlin spokesman Dmitry Peskov, who said that the West’s responses were “not much cause for optimism”.

After weeks of growing tensions and a Russian buildup of troops along the Ukrainian border, President Putin issued a presidential decree on February 21 recognizing the independence of the Luhansk and Donetsk republics, which have deep ties to Russia and where the majority of the populations’ first language is Russian.”[ii] The next day, Russia’s parliament, the Duma, authorized the use of force in Ukraine. Two days later, on February 24, the invasion of Ukraine began.

Thus far, the military assault is focused in the eastern Ukrainian provinces and near Kiev, and the United Nations reports that nearly 1.5 million Ukrainians have been displaced. In the coming days, Russia and Ukraine will continue talks, but not many are optimistic.

President Zelensky is demanding that NATO impose a no-fly zone over his country, warning that “all the people who die from this day forward will die because of you”.[iii] On Saturday, March 5, President Putin warned the West, “Any movement in this direction will be considered by us as participation in an armed conflict by that country.”

The geopolitical risks today cannot be understated, and could quickly push the United States and Russia into a standoff not seen since the Cuban Missile Crisis. For investors, the important variables to monitor in the coming days and weeks is the extent to which the West will “participate” in fighting in Ukraine, and the risk of a direct conflagration between US/NATO and Russian troops.

In addition to the risk of an expanded fight – particularly between the West and Russia -- there is a major risk to global financial conditions. It’s possible that the economic toll and sanctions could have a knock-on effect on the banking system and the flow of credit.

For example, the Biden Administration and the European Union issued its first round of sanctions on February 22, which were aimed at two Russian banks, Russian sovereign debt, and certain individuals.[iv] Then, by the weekend of February 26-27, the European Commission revealed that it was considering sanctions that it could target up to 70% of the Russian banking industry. On February 28, the ECB announced that the European subsidiary of Sberbank Europe AG and two subsidiaries were failing or likely to fail due to a deterioration in their liquidity situation.[v] The next day, European regulators announced that the Sberbank AG would enter insolvency proceedings.

This news of Sberbank’s European subsidiary failing correlated with the relatively sudden and significant widening in credit spreads, suggesting a sudden panic in global liquidity conditions. Specifically, the Moody’s Baa-Aaa credit spread widened from 73 basis points on February 22 to 91 basis points on February 28.

[i] “U.S. Responds to Russia Security Demands as Ukraine Tensions Mount”, by Humeyra Pamuk and Dmitry Antonov, January 26, 2022, Reuters.
[ii] “Putin Recognizes Independence of Ukraine Breakaway Regions”, February 21, 2022, Al Jazeera.
[iii] “Ukraine no-fly zone would mean participation in conflict: Putin”, March 5, 2022, Al Jazeera.
[iv] U.S. and Allies Impose Sanctions on Russia as Biden Condemns ‘Invasion’ of Ukraine”, by Michael Shear, Richard Perez-Pena, Zolan Kanno-Youngs, and Anton Troianovski, February 22, 2022, New York Times.
[v] “Austria-based Russian Bank Declared Insolvent Due to Sanctions”, March 4, 2022, The Local.

DIAL IN FOR OUR MONTHLY
EVENT-DRIVEN CALL
Every 3rd Wednesday at 2:00pm EST

REGISTER FOR CALL

Paul Hoffmeister is chief economist and portfolio manager at Camelot Portfolios, managing partner of Camelot Event-Driven Advisors, and co-portfolio manager of the Camelot Event-Driven Fund (tickers: EVDIX, EVDAX).

Camelot Event-Driven Advisors LLC | 1700 Woodlands Drive | Maumee, OH 43537


Disclosures:
• Past performance may not be indicative of future results. Therefore, no current or prospective client should assume that the future performance of any specific investment, investment strategy (including the investments and/or investment strategies recommended by the adviser), will be profitable or equal to past performance levels.
• This material is intended to be educational in nature, and not as a recommendation of any particular strategy, approach, product or concept for any particular advisor or client. These materials are not intended as any form of substitute for individualized investment advice. The discussion is general in nature, and therefore not intended to recommend or endorse any asset class, security, or technical aspect of any security for the purpose of allowing a reader to use the approach on their own. Before participating in any investment program or making any investment, clients as well as all other readers are encouraged to consult with their own professional advisers, including investment advisers and tax advisors. Camelot Event Driven Advisors can assist in determining a suitable investment approach for a given individual, which may or may not closely resemble the strategies outlined herein.
• Any charts, graphs, or visual aids presented herein are intended to demonstrate concepts more fully discussed in the text of this brochure, and which cannot be fully explained without the assistance of a professional from Camelot Portfolios LLC. Readers should not in any way interpret these visual aids as a device with which to ascertain investment decisions or an investment approach. Only your professional adviser should interpret this information.
• Some information in this presentation is gleaned from third party sources, and while believed to be reliable, is not independently verified.
• Camelot Event-Driven Advisors, LLC, is registered as an investment adviser with the United States Securities and Exchange Commission. Registration as an investment adviser does not imply any certain degree of skill or training. Camelot Event-Driven Advisors, LLC’s disclosure document, ADV Firm Brochure is available at http://adviserinfo.sec.gov/firm/summary/291798

Copyright © 2021 Camelot Event-Driven Advisors, All rights reserved. B333