Commentaries — Camelot Portfolios

Strong Employment Doesn’t Mean All’s Well

by Paul Hoffmeister, Chief Economist

  • The US unemployment rate was 3.7% in May, and other employment data indicate a very high number of job openings and jobs added last month.

  • But the strong labor market does not mean that the US will avoid recession. In fact, history suggests that a recession will begin soon.

  • The unemployment rate tends to reach a cyclical low point right before recession.

  • The Treasury curve and Leading Economic Indicators suggest a recession will begin during the next 12 months. Based on data going back more than 60 years, it will be unprecedented if this didn’t happen.

  • During the second half of 2023, we’re likely to see: unemployment rise, the economy contract, earnings revised lower, and equity markets challenged.

The labor market appears to be so hot that it’s bucking recession concerns. Last week, the Bureau of Labor Statistics released the Job Openings and Labor Turnover Survey (“JOLTS” Survey), showing the US economy had 10.1 million unfilled jobs for the month of April – 750,000 more openings than the 9.35 million that Wall Street expected. For context, the record high for job openings is over 12 million in March 2022; and in February 2020, just prior to the Covid pandemic, openings were just less than 8 million.

Also released last week was the Employment Report, showing the economy added 339,000 jobs in May. Year-to-date, the economy is adding over 300,000 new jobs per month. And even though the unemployment rate rose slightly to 3.7% from 3.4% in April, the low reading two months ago was a 54-year low.

Indeed, employment data like this reflects a strong labor market and resilient economy in the face of the fast and aggressive rate increases by the Federal Reserve, which have raised the federal funds rate from near zero to more than 5% since early 2022.

Is this something to take comfort in? As investors, does the strong labor market allow us to rest easy that the economy will be resilient and avoid recession during the next year? Frankly, we’d say no.

Despite the recent employment data, the economy is vulnerable to falling into a recession, and it could happen surprisingly soon. History has shown that the unemployment rate reaches a cyclical low point right the onset of recession. Moreover, a number of recessions in the past began when the unemployment rate hovered near 4%.

The above chart illustrates how strong labor markets don’t necessarily preclude recession. Furthermore, it shows how the unemployment rate is more of a backward-looking indicator than forward-looking indicator.

And as we’ve expressed many times, forward-looking indicators like leading economic indicators or the yield curve are signaling a high probability of recession soon.

For example, the Index of Leading Economic Indicators for the United States has been consistently weakening since February 2022, and to such a degree that ominously resembles major economic downturns of the last 60 years. According to the Conference Board: “…The LEI continues to warn of an economic contraction this year. [The Board] forecasts a contraction of economic activity starting in Q2 leading to a mild recession by mid-2023.”

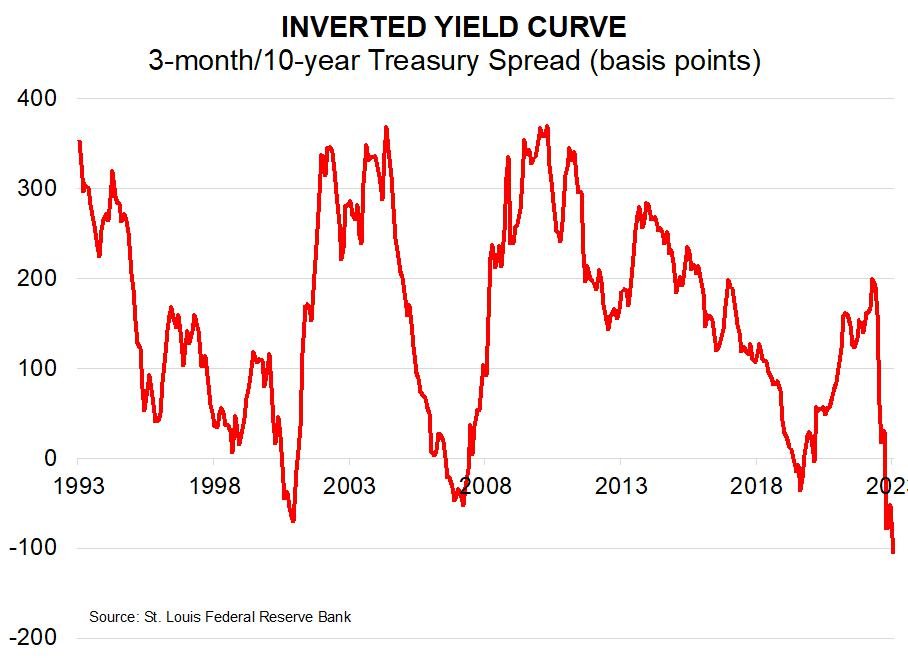
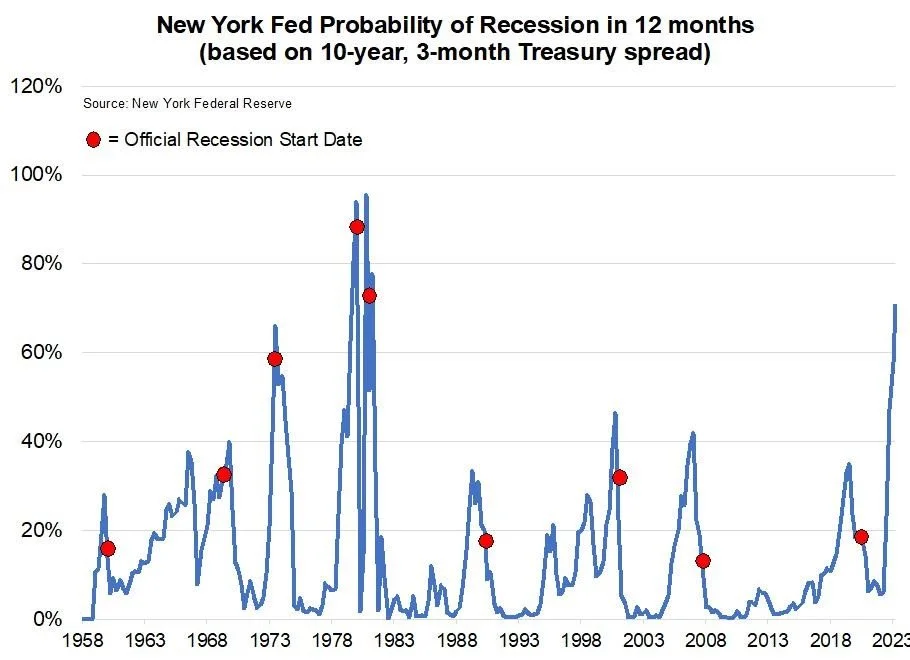
At the same time, the New York Federal Reserve estimates a 71% probability that a recession will begin during the next 12 months. This is based on the negative spread between the 10-year and 3-month Treasuries; otherwise known as the “inverted yield curve”.

Although the strong labor market is welcome news these days and it’s arguably helping to support earnings and equity prices, the strong employment data of recent months is a snapshot of the past. In fact, a low unemployment rate during the last six decades hasn’t prevented recessions, and low unemployment rates tend to precede the onset of recession.

Even more, forward-looking indicators are screaming that a recession will begin soon. This means that during the next year, we’re likely to see unemployment rise, the economy contract, earnings revised lower, and equity returns challenged.

DIAL IN FOR OUR QUARTERLY
EVENT-DRIVEN CALL
3rd Wednesday of every quarter at 2:00pm EST

REGISTER FOR CALL

Paul Hoffmeister is chief economist and portfolio manager at Camelot Portfolios, managing partner of Camelot Event-Driven Advisors, and co-portfolio manager of the Camelot Event-Driven Fund  (tickers: EVDIX, EVDAX).

Camelot Event-Driven Advisors LLC | 1700 Woodlands Drive | Maumee, OH 43537 // B481

Disclosures:
•       Past performance may not be indicative of future results. Therefore, no current or prospective client should assume that the future performance of any specific investment, investment strategy (including the investments and/or investment strategies recommended by the adviser), will be profitable or equal to past performance levels.
•       This material is intended to be educational in nature, and not as a recommendation of any particular strategy, approach, product or concept for any particular advisor or client.  These materials are not intended as any form of substitute for individualized investment advice.  The discussion is general in nature, and therefore not intended to recommend or endorse any asset class, security, or technical aspect of any security for the purpose of allowing a reader to use the approach on their own.  Before participating in any investment program or making any investment, clients as well as all other readers are encouraged to consult with their own professional advisers, including investment advisers and tax advisors.  Camelot Event Driven Advisors can assist in determining a suitable investment approach for a given individual, which may or may not closely resemble the strategies outlined herein.
•       Any charts, graphs, or visual aids presented herein are intended to demonstrate concepts more fully discussed in the text of this brochure, and which cannot be fully explained without the assistance of a professional from Camelot Portfolios LLC.  Readers should not in any way interpret these visual aids as a device with which to ascertain investment decisions or an investment approach.  Only your professional adviser should interpret this information.
•       Some information in this presentation is gleaned from third party sources, and while believed to be reliable, is not independently verified.
•       Camelot Event-Driven Advisors, LLC, is registered as an investment adviser with the United States Securities and Exchange Commission. Registration as an investment adviser does not imply any certain degree of skill or training. Camelot Event-Driven Advisors, LLC’s disclosure document, ADV Firm Brochure is available at http://adviserinfo.sec.gov/firm/summary/291798

Copyright © 2023 Camelot Event-Driven Advisors, All rights reserved.

Major Bank Support; What Next?

by Paul Hoffmeister, Chief Economist

The Federal Reserve and US government moved to aggressively support banks in March. At the same time, the market expects a major reversal in Fed policy.

  • But macroeconomic indicators continue to send worrisome signals; banking risks remain; and Fed officials are not yet calling for interest rate cuts.

  • The yield curve suggests another major drawdown is likely in equities.

Despite the fact that a banking panic erupted last month, the S&P 500 is up nearly 8% year-to-date, and the Nasdaq is up almost 16%. This resilience in risk-taking can be largely attributed to the major banking-related support from the Federal Reserve and US government during the last month, as well as the dramatically dovish change in the Fed outlook.

Specifically, in response to the failures of Silicon Valley Bank and Signature Bank in March, the Fed created a new bank lending program called the Bank Term Funding Program (BTFP), for banks to receive loans on collateral valued at par, as opposed to lower mark-to-market valuations that would force those banks to realize massive losses. Many believe that sizable unrealized losses were primarily behind the deposit runs at SVB and Signature and ignited the concerns about the viability of many other banks.

What led to those sizeable unrealized losses? Due to rising interest rates of the last year, longer term maturity assets, such as Treasuries and mortgage-backed securities, acquired by banks when interest rates were lower, became worth less than their face values. According to the FDIC, at the end of 2022, the total unrealized losses on available for sale and held to maturity securities was $620 billion.[i]The scale of these unrealized losses suggests that the BTFP is one of the biggest bank support programs in history.The famous TARP program of 2008 was initially authorized to spend $700 billion; and total disbursements were less than $500 billion according to the Congressional Budget Office.

Concurrent with the new BTFP program, the FDIC and US Treasury announced that all deposits at SVB and Signature Bank would be guaranteed, arguably giving confidence to financial markets and investors that potential bank contagion would be defused for the near-term.

In addition to these major actions, the interest rate outlook has turned dramatically dovish during the last month. On March 6 -- days before the SVB/Signature turmoil – federal funds futures were expecting the Fed’s target overnight rate to be 5.50% by year-end; as of last Friday, the market expected a year-end funds rate of 4.48%.[ii] The recent bank troubles as well as softening inflation and growth data have worked together to keep Fed rate expectations dovish.

Arguably, financial markets seem to have a great degree of confidence that banking problems are contained, and that the Federal Reserve will soon terminate the interest rate hiking cycle that has pained markets during the last year and that it’ll even start to ease later this year.

This is certainly possible. But, in our view, this doesn’t mean that we see an all-clear signal to add significant risk today. There are still a handful of significant risks.

First, a variety of macroeconomic data that we’ve been highlighting in recent months appear to suggest a substantial economic slowdown will soon occur. For example, the yield curves for the major western economies – United States, Canada, UK, France and Germany – were each inverted as of last week; something we haven’t seen in the last 20 years. Leading economic indicators remain negative. And, even before last month’s bank turmoil, banks were already signaling tighter lending conditions. Now, with the recent bank problems, the prospect of reduced loan volumes for the US economy looks even dimmer. All together, these are worrisome signs of a pending slowdown.

Second, we don’t believe that banking risks are completely behind us, and this seems to be confirmed by recent market behavior. The S&P Regional Bank Index has not rallied with broad market indices during the last month. In fact, the bank index is trading lower today than it did during the week following the demise of SVB and Signature Bank. It’s worth noting, too, that famed investor Warren Buffett revealed last week that he had recently sold stakes in several banks.

So, what would the market for bank stocks still be concerned about? The market could still be worried about deposit outflows similar to what occurred at SVB and Signature, rising costs for deposits held at banks that will likely reduce future bank earnings, and possibly significant credit risk if the economy markedly deteriorates.

In early March, FDIC Chairman Martin Gruenberg highlighted a number of areas of potential credit risk for banks. He noted modest increases in auto loan and credit card charge-offs in 2022, and the potential for this to increase should cash-strapped consumers face even greater repayment difficulties.[iii]

Gruenberg also highlighted the surge last year in commercial real estate loans (CRE) and construction and development loans (C&D loans), which increased 10.7% and 16.5% respectively. While commercial property generally performed well in 2022, these could be of concern if the economy entered recession. He added that structural trends toward remote work raise the question of whether this has permanently and materially reduced the need for office space. According to Gruenberg: “Since the start of the pandemic, the national average office vacancy rate has trended upwards, from about 9.6 percent at March 31, 2020, to about 12.5 percent as of yearend 2022. As of the fourth quarter of 2022, five major metropolitan areas had office vacancy rates between 15 percent and 20 percent.” Those cities are Chicago, Dallas, Houston, San Francisco, and Washington, D.C.

While lower occupancies could lead to lower rents and operating income by office properties, higher interest rates could make future refinancings more expensive. According to Gruenberg, approximately $56 billion in loans financing office properties that are collateral for commercial mortgage-backed securities are coming due in the next 3 years. If the valuations of these properties suffer, it could be present a challenge for their owners, including banks that hold some of these loans as assets on their balance sheets.

Therefore, while the recent banking worries appear to have been contained for now, there are still risks to banks, especially if the economy slows significantly. Commercial real estate, as well as auto and credit card loans, could be market segments to watch.

Lastly, most Fed officials do not yet seem to agree with the market’s dovish rate outlook. Most officials expect the funds rate to end the year between 5% and 5.25%. Even more, in recent weeks, St. Louis Fed President Jim Bullard raised his year-end target for the funds rate to 5.5%-5.75% “in reaction to the stronger economic news and also on the assumption that the financial stress abates in the weeks and months ahead.” Additionally, Fed Governor Chris Waller, while not affirming an exact year-end target, said last week, “Monetary policy will need to remain tight for a substantial period of time, and longer than markets anticipate.” Both men cited the strong labor market and inflation that’s running higher than the Fed’s 2% target.

With no Fed official yet calling for rate cuts, Fed policy remains well out of line with market expectations. Even worse, it suggests that the Fed might not begin cutting interest rates until it’s forced to, by either significantly weak financial markets and/or much weaker economic data.

Conclusion: Despite the recent market optimism and risk-taking, we do not believe there’s an all-clear “risk on” signal for investors because of many macroeconomic data points that portend recession, persistent risks at banks especially if the economy slows, and an official Fed policy position that is not yet signaling a reversal in policy.

The yield curve, as measured by the spread between the 10-year Treasury and 3-month T-bill, is the most inverted it has been since the early 1980s. The correlation between this part of the yield curve and the S&P 500 suggests that equity returns will be challenged during the next year, and another major drawdown in equities could be likely. We expect it would be due to economic and/or financial panic that will then force the Fed to begin reversing its hawkish policy of the last year.

[i] “Remarks by FDIC Chairman Martin Gruenberg at the Institute of International Bankers,” by Martin Gruenberg, March 6, 2023.
[ii] Source: Bloomberg.
[iii] “Remarks by FDIC Chairman Martin Gruenberg at the Institute of International Bankers,” by Martin Gruenberg, March 6, 2023.

DIAL IN FOR OUR MONTHLY
MARKET UPDATE CALL
Every 2nd Tuesday at 11:00am EST

REGISTER FOR CALL

Paul Hoffmeister is chief economist and portfolio manager at Camelot Portfolios, managing partner of Camelot Event-Driven Advisors, and co-portfolio manager of the Camelot Event-Driven Fund  (tickers: EVDIX, EVDAX).

Camelot Portfolios LLC | 1700 Woodlands Drive | Maumee, OH 43537 // B463
 
Disclosures:
•       Past performance may not be indicative of future results. Therefore, no current or prospective client should assume that the future performance of any specific investment, investment strategy (including the investments and/or investment strategies recommended by the adviser), will be profitable or equal to past performance levels.
•       This material is intended to be educational in nature, and not as a recommendation of any particular strategy, approach, product or concept for any particular advisor or client.  These materials are not intended as any form of substitute for individualized investment advice.  The discussion is general in nature, and therefore not intended to recommend or endorse any asset class, security, or technical aspect of any security for the purpose of allowing a reader to use the approach on their own.  Before participating in any investment program or making any investment, clients as well as all other readers are encouraged to consult with their own professional advisers, including investment advisers and tax advisors.  Camelot Event Driven Advisors can assist in determining a suitable investment approach for a given individual, which may or may not closely resemble the strategies outlined herein.
•       Any charts, graphs, or visual aids presented herein are intended to demonstrate concepts more fully discussed in the text of this brochure, and which cannot be fully explained without the assistance of a professional from Camelot Portfolios LLC.  Readers should not in any way interpret these visual aids as a device with which to ascertain investment decisions or an investment approach.  Only your professional adviser should interpret this information.
•       Some information in this presentation is gleaned from third party sources, and while believed to be reliable, is not independently verified.
•       Camelot Portfolios, LLC, is registered as an investment adviser with the United States Securities and Exchange Commission. Registration as an investment adviser does not imply any certain degree of skill or training. Camelot Portfolios, LLC’s disclosure document, ADV Firm Brochure is available at www.camelotportfolios.com

Copyright © 2023 Camelot Portfolios, All rights reserved.

Early Stages of a Slowdown

by Paul Hoffmeister, Chief Economist

As many clients know from our previous letters and conference calls, we have been very cautious about the overall economic and financial environments because of the interest rate shock from the Fed’s aggressive interest rate campaign. Something was likely to “break”, and the first example of that in the United States appears to have been the collapse of Silicon Valley Bank last Friday.

In short, the quick and steep rise in interest rates eroded the value of long-term bonds owned by the bank; and as depositors made withdrawals in recent weeks, the bank was forced to realize those losses and seek new capital. Unfortunately, worries about the viability of the bank appear to have triggered a run on the bank late last week, leading to its takeover by the FDIC.

The federal government has guaranteed the deposits at SVB, and the Federal Reserve initiated a new emergency program called the Bank Term Funding Program, which will allow banks to pledge bonds such as Treasuries and mortgage-backed securities so they can meet withdrawals without selling those bonds for a loss and risking further bank runs.

So where does this leave us? Has the pain completely emerged? Will this backstop for banks create a foundation for a reinvigorated market outlook?

Quite simply, we remain concerned – because the demise of Silicon Valley Bank appears to be mostly symptomatic of the interest rate hikes themselves and not yet of a major economic downturn. In other words, Silicon Valley Bank’s problems weren’t significantly related to the economy, and the economy has not yet meaningfully turned lower. Unfortunately, we believe the downturn is in its early stages and this will ultimately create pressure beyond the banks and on to consumers and corporations.

It’s particularly worrisome is that SVB’s failure is the result of interest hikes that have reduced the value of assets on the balance sheet. This is an unusual case of a bank’s collapse. In a typical bank failure, credit losses cause a capital depletion, leading to an insolvency. However, the banking system does not appear to be experiencing meaningful credit losses at this point. For some context: according to the FDIC, of the nearly $2.2 trillion in bank equity among US banks at the end of 2022, $620 billion would be wiped out if the asset losses due to interest rate hikes were recognized, leaving significantly less capital in the banking system to weather credit losses in a major economic downturn.

Because the economy is incredibly complex, economic indicators can be quite nebulous. Notwithstanding, we present in the following charts certain data that strongly suggest to us that the economy is entering a significant downturn.

The charts, in sum, suggest that a simultaneous and severe slowdown is occurring in the western world. During the last 30 years, we’ve never seen a simultaneous yield curve inversions in the United States, Canada, UK and Germany to the degree that we see today. In our view, this a very ominous signal. As for the US economy, we also see that the manufacturing and services sectors are weakening to degrees reminiscent of 2000 and 2008; a major inventory downturn appears to be underway; home prices are weakening quickly; unemployment is about to rise; and bank lending is about to worsen.

This diverse set of data points to a significant economic recession and earnings slowdown. Therefore, our highly cautious view of the market remains unchanged.

Inverted Yield Curves in Western Economies: Ominous Signal?

Leading Economic Indicators Are Worrisome

U.S. Manufacturing and Services Sectors Are Slowing

Oil Inventories Rising: Less Demand from Economy?

Beginning of Inventory Liquidations?

Housing Market Is Slowing

Weak Shipping Costs Suggest Weak Global Economy

Beginning of Major Layoffs?

Bank Lending Likely to Decline: Less Future Demand

DIAL IN FOR OUR MONTHLY
MARKET UPDATE CALL
Every 2nd Tuesday at 11:00am EST

REGISTER FOR CALL

Paul Hoffmeister is chief economist and portfolio manager at Camelot Portfolios, managing partner of Camelot Event-Driven Advisors, and co-portfolio manager of the Camelot Event-Driven Fund  (tickers: EVDIX, EVDAX).

Camelot Portfolios LLC | 1700 Woodlands Drive | Maumee, OH 43537 // B456
Disclosures:
•       Past performance may not be indicative of future results. Therefore, no current or prospective client should assume that the future performance of any specific investment, investment strategy (including the investments and/or investment strategies recommended by the adviser), will be profitable or equal to past performance levels.
•       This material is intended to be educational in nature, and not as a recommendation of any particular strategy, approach, product or concept for any particular advisor or client.  These materials are not intended as any form of substitute for individualized investment advice.  The discussion is general in nature, and therefore not intended to recommend or endorse any asset class, security, or technical aspect of any security for the purpose of allowing a reader to use the approach on their own.  Before participating in any investment program or making any investment, clients as well as all other readers are encouraged to consult with their own professional advisers, including investment advisers and tax advisors.  Camelot Event Driven Advisors can assist in determining a suitable investment approach for a given individual, which may or may not closely resemble the strategies outlined herein.
•       Any charts, graphs, or visual aids presented herein are intended to demonstrate concepts more fully discussed in the text of this brochure, and which cannot be fully explained without the assistance of a professional from Camelot Portfolios LLC.  Readers should not in any way interpret these visual aids as a device with which to ascertain investment decisions or an investment approach.  Only your professional adviser should interpret this information.
•       Some information in this presentation is gleaned from third party sources, and while believed to be reliable, is not independently verified.
•       Camelot Portfolios, LLC, is registered as an investment adviser with the United States Securities and Exchange Commission. Registration as an investment adviser does not imply any certain degree of skill or training. Camelot Portfolios, LLC’s disclosure document, ADV Firm Brochure is available at www.camelotportfolios.com

Copyright © 2023 Camelot Portfolios, All rights reserved.

Unattractive Equity Outlook

by Paul Hoffmeister, Chief Economist

As clients might know from our previous letters and conference calls, we believe that the currently inverted yield curve effectively being spearheaded by the Fed’s aggressive rate-hiking campaign is signaling a high likelihood of recession during the next year. As of Friday, the 3-month/10-year Treasury spread traded at a negative 107 basis points. This is a historic degree of inversion, which we haven’t seen since the early 1980s, which has only increased our concern about the economy weakening significantly in the near future. The last three times that this segment of the curve inverted was in 2000, 2006 and 2019. Of course, each of those years preceded major ructions in the economy: the Tech Wreck, the Great Financial Crisis, and the Covid Pandemic. Notably, in each of those instances, the yield curve did not invert as much as it has today.

So, while we may feel confident in the view that the US economy will slow meaningfully in 2023, what does this mean for equities? After all, with many equity indices having fallen 20% to 30% last year, doesn’t that set us up for stronger equity returns in 2023? We’re not so optimistic.

According to Bloomberg, analysts are generally expecting the S&P 500 Index to earn about $225 per share in 2023. If one applies a 20 multiple to those earnings (we’d argue that a lower multiple is more appropriate), that would equate to a 4500 year-end price target in the S&P 500. With the Index starting the year at 3839.50, that would be an attractive +17.2% return this year, not including dividends.

Unfortunately for the outlook, when one looks at the three previous periods of yield curve inversions (2000, 2006 and 2019), S&P 500 earnings declined substantially, by at least 30%. That would equate to $157.50 per share and, at a generous 20 multiple, a 3150 target for the S&P 500 or -18% return (not including dividends).

If one assumed that the economy will only suffer a shallow recession and earnings slowdown this year and therefore assumed, let’s say, a 10%-15% decline in earnings to $191.25-$202.5, this would equate to a 3825 to 4050 S&P 500 by year-end at a 20 multiple; in other words, about a -0.40% to +5.5% return for 2023 (not including dividends).

Adding to our lack of enthusiasm for equity returns this year and bolstering our view that earnings will decline are clues that the US economy is already weakening, in a way reminiscent of the economic malaises of the last 20 years.

Specifically, the Institute for Supply Management’s Manufacturing PMI registered below 50 in November and December, indicating that the manufacturing sector is already shrinking. But even more notable, the ISM Services PMI registered a sub-50 reading for December. This services reading tends to shrink less frequently than manufacturing and appears to be a better predictor of a broader economic weakness. For example, each of the last times this index fell below 50 to signal a shrinkage in the services sector, the recessions associated with the Tech Wreck, Great Financial Crisis, and Covid Pandemic followed.

Amidst all this, unfortunately, the Federal Reserve remains intent on raising short-term interest rates to slow the economy even more and is telegraphing to markets that once it’s done with its rate hikes, it plans to keep interest rates high for a prolonged period of time.

Indeed, news in the coming weeks or months that the Fed is done with its rate-hiking cycle could spark some relief and strength in equities. But this arguably won’t adequately reflect the delayed effects of high interest rates and anti-growth monetary policy that will likely weigh on the economy throughout the first half of 2023. As such, today’s extreme yield curve inversion and emergent signs of economic weakness lead us to believe that corporate earnings are highly vulnerable to a decline in the coming year. And as a result, the risk-reward for equities in general is unattractive.

DIAL IN FOR OUR MONTHLY
MARKET UPDATE CALL
Every 2nd Tuesday at 11:00am EST

REGISTER FOR CALL

Paul Hoffmeister is chief economist and portfolio manager at Camelot Portfolios, managing partner of Camelot Event-Driven Advisors, and co-portfolio manager of the Camelot Event-Driven Fund  (tickers: EVDIX, EVDAX).

Camelot Portfolios LLC | 1700 Woodlands Drive | Maumee, OH 43537 // B435

 
Disclosures:
•       Past performance may not be indicative of future results. Therefore, no current or prospective client should assume that the future performance of any specific investment, investment strategy (including the investments and/or investment strategies recommended by the adviser), will be profitable or equal to past performance levels.
•       This material is intended to be educational in nature, and not as a recommendation of any particular strategy, approach, product or concept for any particular advisor or client.  These materials are not intended as any form of substitute for individualized investment advice.  The discussion is general in nature, and therefore not intended to recommend or endorse any asset class, security, or technical aspect of any security for the purpose of allowing a reader to use the approach on their own.  Before participating in any investment program or making any investment, clients as well as all other readers are encouraged to consult with their own professional advisers, including investment advisers and tax advisors.  Camelot Event Driven Advisors can assist in determining a suitable investment approach for a given individual, which may or may not closely resemble the strategies outlined herein.
•       Any charts, graphs, or visual aids presented herein are intended to demonstrate concepts more fully discussed in the text of this brochure, and which cannot be fully explained without the assistance of a professional from Camelot Portfolios LLC.  Readers should not in any way interpret these visual aids as a device with which to ascertain investment decisions or an investment approach.  Only your professional adviser should interpret this information.
•       Some information in this presentation is gleaned from third party sources, and while believed to be reliable, is not independently verified.
•       Camelot Portfolios, LLC, is registered as an investment adviser with the United States Securities and Exchange Commission. Registration as an investment adviser does not imply any certain degree of skill or training. Camelot Portfolios, LLC’s disclosure document, ADV Firm Brochure is available at www.camelotportfolios.com

Copyright © 2023 Camelot Portfolios, All rights reserved.

Crypto Needs A Reset Button

by Thomas Kirchner, CFA

  • Crypto fails to live up to its promises of peer-to-peer disintermediation.

  • Abysmal safety and soundness.

  • Reboot and return to its roots are needed.

The FTX debacle puts a hard stop to the dream of alternative digital currencies. A peer-to-peer cash system without banks or central banks was the promise of Satoshi Nakamoto's original Bitcoin white paper [i]. What we ended up with is a carbon copy of the fiat monetary system, but without its protections and safeguards. The result is that crypto investors lose billions, most recently from the suspected fraud at FTX.

Crypto copies fiat

The path crypto currencies have taken over the last 15 years has no connection to the ideals its early prophets had in mind. They were looking to establish alternatives to what many consider an errant monetary fiat system. However, if we look at the state of the crypto industry today, we find an industry structure that resembles the conventional fiat banking and brokerage system surprisingly closely. Little is left of the original peer-to-peer concept. Instead, crypto has become completely intermediated.

Few crypto users have the technical skills to hold their coins in a real wallet, much less transact on the blockchain. Therefore, service providers help users out by letting them open an account, in which they can store their coins and make transactions. This is no different than traditional banking and brokerage, except that, as we will discuss later, these intermediaries also run an order book to match buyers and sellers like a traditional securities exchange. In fact, that's what they are called – exchanges.

The parallels go even further. Exchanges extend credit to their customers, like a traditional broker in a margin or prime brokerage account. A wide range of derivatives is also available. Clearly, none of this is peer-to-peer, but fully intermediated like in the fiat banking and brokerage system. And with that come the same counterparty and fraud risks as in the fiat system, except that the crypto world is severely underdeveloped in its safety and soundness.

Prevalence of pump-and-dump schemes

That something was amiss in crypto land became apparent when the Terra-Luna pair of stablecoins collapsed in a rather unstable descent in October. Two interlinked tokens raise red flags. It appears that one token props up the other, while the second props up the first. It is a circular pump-and-dump scheme. It is now known that Sam Bankman-Fried admitted as much in a Bloomberg “Odd Lots” podcast with Matt Levine as early as April 2022. Of course, using one token to prop up the other has nothing to do with the original disintermediated peer-to-peer concept underlying cryptocurrencies, but when everyone makes money, such details didn't seem to bother anyone.

Similarly, nobody seemed to question the double-digit yields offered by some crypto schemes. If we were running a crypto project that were producing legitimately high yields in the double digits, we would not pay out that much to investors. Instead, we would pay them a generous high single digit yield, while fattening our own bottom line with the extra spread. A legitimate single digit yield would still be enough to attract plenty of yield starved investors. Clearly, double digit yields are offered by those who cannot actually generate a return in order to part the gullible and clueless from their money.

Exchanges are the weak link

For most people, the only practical way to access crypto currencies is to invest through an exchange. Exchanges are very different from other securities markets in that they act as brokers who hold the funds, while simultaneously running the order book. And they are not particularly efficient at running order books. While high frequency trading has generated lots of headlines on traditional stock exchanges with microsecond execution, known as latency in industry parlance, crypto exchanges are notorious for their slow speed. The fastest exchange we found at a recent check was Coinbase with a lame 180 milliseconds, while the exchange at the 95th percentile ranking had an astonishingly poor 1.8 second latency[ii]. This compares with as little as 26 microseconds for the NYSE [iii], faster by a factor of almost 7,000 than best-in-class Coinbase. That's a terrible verdict for the crypto bros, who are often technology geniuses, yet cannot beat the incumbents in technology. Latency measured in seconds is what we had three decades ago in open outcry futures pits.

As an alternative technology to traditional stock exchanges, crypto exchanges clearly are unsuitable. But the technical challenges of exchanges don't end there. If you want your crypto assets to be safe, you can withdraw them and place them in an offline wallet. However, we venture the guess that most clients of crypto exchange have no idea how to get their cryptocurrencies out of the exchange and into cold storage. With a bank account, it's easy: you go to an ATM and withdraw fiat currency. For most exchange customers, the only option to recover their investment is to transfer fiat currency from their exchange to a bank account. This, in turn, makes exchanges particularly vulnerable to bank runs. We would argue that in the absence of exchanges, with the current state of crypto technology, it would be more practical to use gold coins than crypto to make payments.

Exchanges are the critical infrastructure of the current crypto industry structure, and they are the weak link. At the same time, the need for an exchange to make crypto currencies usable negates the entire appeal of peer-to-peer digital currencies. In fact, much of crypto today resembles traditional finance, with crypto lurking somewhere in the background. Claiming crypto exchanges have something to do with crypto currencies is a bit like claiming that the dollar is gold backed just because the Fed holds a lot of gold in Fort Knox. In reality, crypto exchanges are leveraged balance sheets indexed on Bitcoin and other crypto currencies.

Crypto 2.0 versus the government

Just like the dot-com bust of 2000 was not the end of the internet, crypto will reboot from its current crisis. Somebody will figure out actual use cases and solutions to the shortcomings of the current crypto infrastructure. We doubt that the world needs 100s of cryptocurrencies, and thousands of VC-funded solutions for crypto-specific problems for which there is no actual business case.

The question is how the government will react to the scandals. We suspect that regulation will accelerate the reboot of the sector as crypto 2.0: exchanges will be regulated out of business, more or less. This, in turn, will give innovators the opportunity to return to the original concept and create a genuine peer-to-peer infrastructure that does not rely on intermediaries.

[i] Satoshi Nakamoto: “Bitcoin: A Peer-to-Peer Electronic Cash System” Available at bitcoin.org/en/bitcoin-paper
[ii] https://www.api.expert/collection/crypto-currency-exchanges retrieved on November 20, 2022.
[iii] https://www.nyse.com/data-insights/nyse-pillar-migration-adding-efficiency-to-the-marketplaceretrieved on November 21, 2022.

DIAL IN FOR OUR QUARTERLY
EVENT-DRIVEN CALL
Every 3rd Wednesday of the Quarter at 2:00pm EST

REGISTER FOR CALL

Thomas Kirchner, CFA,

has been responsible

for the day-to-day

management of the

Camelot Event Driven

Fund (EVDIX, EVDAX)

since its 2003

inception. Prior to

joining Camelot he

was the founder of

Pennsylvania Avenue

Advisers LLC and the

portfolio manager of

the Pennsylvania

Avenue Event-Driven

Fund. He is the author

of 'Merger Arbitrage;

How To Profit From

Global Event Driven

Arbitrage.' (Wiley

Finance, 2nd ed 2016)

and has earned the

right to use the CFA

designation.

Camelot Event-Driven Advisors LLC | 1700 Woodlands Drive | Maumee, OH 43537 // B429
Disclosures:
• Past performance may not be indicative of future results. Therefore, no current or prospective client should assume that the future performance of any specific investment, investment strategy (including the investments and/or investment strategies recommended by the adviser), will be profitable or equal to past performance levels.
• This material is intended to be educational in nature, and not as a recommendation of any particular strategy, approach, product or concept for any particular advisor or client. These materials are not intended as any form of substitute for individualized investment advice. The discussion is general in nature, and therefore not intended to recommend or endorse any asset class, security, or technical aspect of any security for the purpose of allowing a reader to use the approach on their own. Before participating in any investment program or making any investment, clients as well as all other readers are encouraged to consult with their own professional advisers, including investment advisers and tax advisors. Camelot Event Driven Advisors can assist in determining a suitable investment approach for a given individual, which may or may not closely resemble the strategies outlined herein.
• Some information in this presentation is gleaned from third party sources, and while believed to be reliable, is not independently verified.
• Camelot Event-Driven Advisors, LLC, is registered as an investment adviser with the United States Securities and Exchange Commission. Registration as an investment adviser does not imply any certain degree of skill or training. Camelot Event-Driven Advisors, LLC’s disclosure document, ADV Firm Brochure is available at http://adviserinfo.sec.gov/firm/summary/291798

Copyright © 2021 Camelot Event-Driven Advisors, All rights reserved.